Purchasing Power Calculator - Inflation and Real Value
See how much buying power your money retains after inflation, estimate future living costs, and compare real savings yields.
🔒 Financial Data Privacy: All numbers are calculated strictly in your browser with zero server storage.
How to Calculate Your Purchasing Power
- Enter your starting dollar balance in Current Amount ($) and your expected yearly price increase in Annual Inflation Rate (%).
- Set the number of whole years you want to evaluate in Time Horizon (Years) (from 1 to 100 years).
- Add an interest rate in Annual Savings Yield (%) (Optional) to compare an interest-bearing account, or leave 0 for cash.
- Review your real purchasing power in today's dollars, future cost equivalent, Fisher real return, and year-by-year schedule below.
Key Features
- Real purchasing power valuation in today's dollars paired with a color-coded retention bar tracking remaining value.
- Future cost equivalent and cumulative inflation calculation showing how much more everyday goods will cost over your timeline.
- Optional savings yield comparison using the exact Fisher equation to measure whether your interest rate loses to or beats inflation.
- Automatic halving time estimate showing how many years it takes for net inflation to cut your buying power by 50%.
- Visual donut chart and year-by-year purchasing power schedule up to 100 years with CSV export and one-click link sharing.
- Private inflation and savings analysis where your cash balances, inflation rates, and yields never leave your screen.
Purchasing Power Formula and Fisher Equation Logic
The Purchasing Power Calculator measures how inflation erodes the real purchasing power of your money and evaluates real savings returns using compound discounting and the exact Fisher equation:
Nominal Balance (FV) = P × (1 + r)^t
Real Purchasing Power = [ P × (1 + r)^t ] / (1 + i)^t
Future Cost Equivalent = P × (1 + i)^t
Real Annual Return (Fisher) = [ (1 + r) / (1 + i) - 1 ] × 100%
Halving Time (Years) = ln(2) / ln[ (1 + i) / (1 + r) ]   (when i > r)
Where P is your starting amount in today's dollars and i is the annual inflation rate in decimal form. Here, r is the optional annual savings yield (or 0 for cash) and t is the time horizon in whole years.
When you hold uninvested cash (r = 0), your nominal balance stays equal to P while your real value shrinks by a factor of (1 + i)^t. Meanwhile, the Future Cost Equivalent shows the future dollar amount required to buy the same basket of goods that costs P today. When you enter a positive savings yield (r > 0), the Fisher equation compares compounding interest against compounding inflation. Your real buying power shrinks when r < i, holds steady at 100% when r = i, and grows in real terms when r > i.
Rounding each annual balance, real dollar value, and future cost to the exact cent keeps your retained buying power and inflation loss aligned across the schedule.
Developed and maintained by the ValuNox team, this inflation analysis tool applies standard real-value discounting and Fisher real interest rate principles.
Financial Disclaimer
Results are for educational and estimation purposes only, not formal financial, tax, or legal advice. Inflation projections assume a constant annual rate based on broad Consumer Price Index (CPI) averages, while actual price changes vary across housing, healthcare, food, and energy. Interest earned in taxable accounts is also subject to national and local income taxes, which can reduce your net real return.
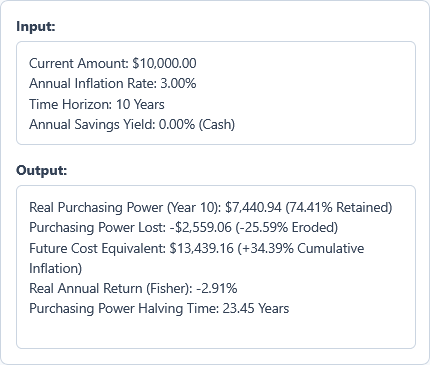
Example Calculation
Example Input
Current Amount: $10,000.00
Annual Inflation Rate: 3.00%
Time Horizon: 10 Years
Annual Savings Yield: 0.00% (Cash)
Example Output
Real Purchasing Power (Year 10): $7,440.94 (74.41% Retained)
Purchasing Power Lost: -$2,559.06 (-25.59% Eroded)
Future Cost Equivalent: $13,439.16 (+34.39% Cumulative Inflation)
Real Annual Return (Fisher): -2.91%
Purchasing Power Halving Time: 23.45 Years
Holding $10,000.00 in uninvested cash at 3.00% annual inflation for 10 years cuts its real buying power by $2,559.06 down to $7,440.94. After a decade, you would need $13,439.16 in future dollars to buy that same $10,000.00 basket of goods.
Frequently Asked Questions
What is the difference between real purchasing power and future cost equivalent?
Real purchasing power shows what your future balance is worth in today's dollars. By contrast, the future cost equivalent shows how many future dollars are needed to buy what your starting amount buys today. At 3% annual inflation over 10 years, $10,000 in cash shrinks to $7,440.94 in real value, while today's $10,000 basket of goods will cost $13,439.16.
Why does the Fisher real return differ from simply subtracting inflation from my interest rate?
Subtracting inflation from your interest rate is only a rough approximation because both interest and inflation compound on top of each other over time. The Fisher equation divides your growth factor by the inflation factor—(1 + r) / (1 + i) - 1—to measure the exact real return on your buying power.
How does compounding inflation erode cash faster over multi-decade retirement horizons?
Every year's price increase builds on top of previous price increases rather than just the original baseline cost. Even 3% annual inflation raises living costs by 34.39% over 10 years and cuts the buying power of uninvested cash in half in 23.45 years.
What happens to my purchasing power during a period of deflation?
During deflation, general prices fall (i < 0%), which increases the real purchasing power of each dollar you hold over time. If you enter a negative inflation rate, the calculator shows a higher real dollar value and a lower future cost equivalent for the same basket of goods.
Why can personal household inflation differ from the headline Consumer Price Index (CPI)?
The headline CPI tracks an average national basket of goods and services, but your personal inflation rate depends on where your household actually spends money. Households spending heavily on rent, tuition, or medical care often experience faster cost increases than the broad national average.
Which financial accounts help protect cash reserves against inflation erosion?
High-yield savings accounts (HYSAs), money market funds, and fixed-term deposits (CDs) help offset inflation on cash reserves. Inflation-indexed government bonds—such as US TIPS, Series I bonds, or UK index-linked gilts—also protect purchasing power. Entering an account's annual yield into the optional savings box shows how much real value is preserved before taxes.
Do my savings balances or inflation figures ever leave my device?
No, every real purchasing power and Fisher return figure is calculated directly on your own screen. Your cash balances, inflation rates, and savings yields stay on your device and are never stored or sent anywhere online.